


Nuclear Magnetic Resonance (NMR) Spectroscopy
Within the past fifty years nuclear magnetic resonance (NMR) spectroscopy has become a leading technique for the determination of the structure of organic compounds on a molecular level.
In NMR, a sample is placed in an external magnetic field, which aligns the spins of the nuclei such as 1H or 13C in the material leading to a magnetic polarization. Subsequent, electromagnetic radio-frequency pulses, enabling resonance with the Lamor frequencies, perpendicular to the static field perturb the polarization of the nuclear spins. As a result of the perturbation a time-dependent magnetic field arises. This magnetic field induces an ac voltage in the coil surrounding the sample. The measurement of the absorption of the magnetic pulses, depending on the frequency, is called NMR spectroscopy.
The structure of polymers can be determined by the chemical shift, defined by the resonance frequency of the nucleus relative to a standard (e.g. tetramethylsilane (TMS)). The structural conformation and shielding effects by the surrounding electrons yield an effective magnetic (B-)field around the nucleus in the polymers. It also changes the chemical shift of the nucleus. Therefore, local variations of the B-field due to local structure and interactions between parts of the molecule are measured by NMR spectroscopy.
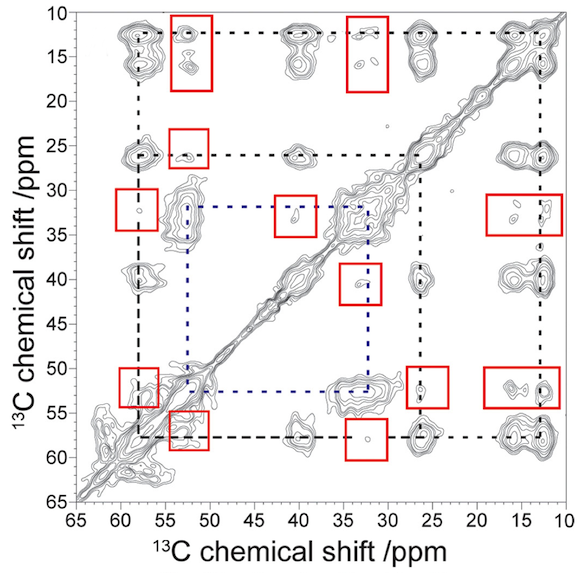
In the CRC project A06 a 13C solid-state NMR measurement was carried out on a biopolymer system (see Figure 1). This technique includes the energy transfer from abundant nuclei (1H) to the observed ones (13C) (cross polarization) to increase the measured signal. Additionally a high spectral resolution is achieved by the rapid rotation of the sample by an angle of 54.74°. This method averages out the dipolar interaction and is called the magic angle spinning (MAS) technique.
The present proton driven spin diffusion experiments are used in densely coupled proton networks, often found in biological samples. Here two nuclei are correlated to obtain a 13C-13C exchange spectra. This spectra shows a 1H-1H mediated 13C-13C contact. During a mixing time spin diffusion occurs between the carbon atoms. This two dimensional method leads to an improved assignment of the NMR peaks and an estimation of distances between different atoms. Therefore the correlation spectra (see Figure 1) will give interesting insight into the tertiary structure of protofibrils.